LEBESGUE\ Estimate the Lebesgue Constant {#lebesgue-estimate-the-lebesgue-constant align=”center”} ==============================
LEBESGUE is a C++ library which is given a set of nodes in 1D, and plots the Lebesgue function, and estimates the Lebesgue constant, which measures the maximum magnitude of the potential error of Lagrange polynomial interpolation, and which uses gnuplot to make plots of the Lebesgue function.
Any set of nodes in the real line X(I), for 1 <= I <= N, defines a corresponding set of Lagrange basis functions:
        L(I)(X) = product ( 1 <= J <= N, J /= I ) ( X    - X(J) )
                / product ( 1 <= J <= N, J /= I ) ( X(I) - X(J) )
with the property that
        L(I)(X(J)) = 0 if I /= J
                     1 if I  = J
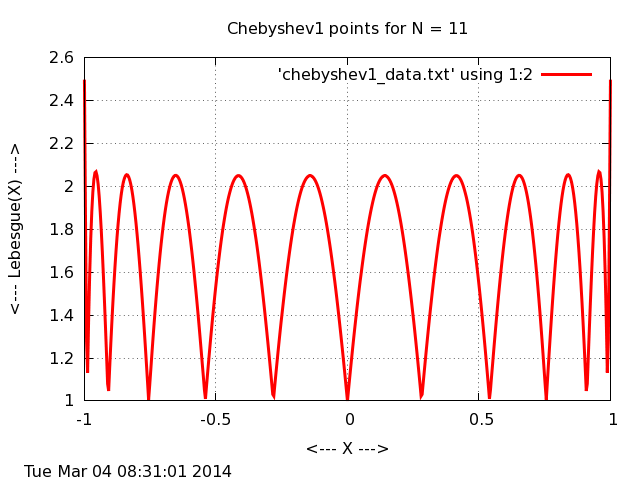
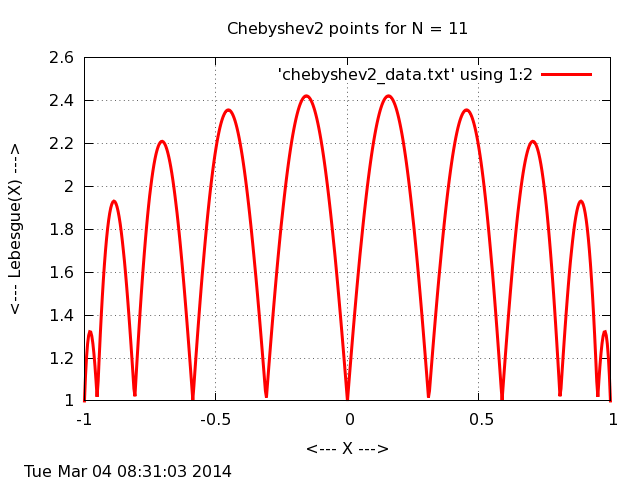
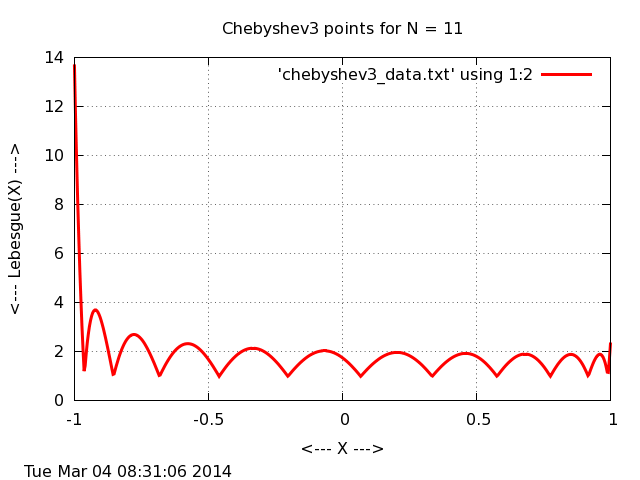
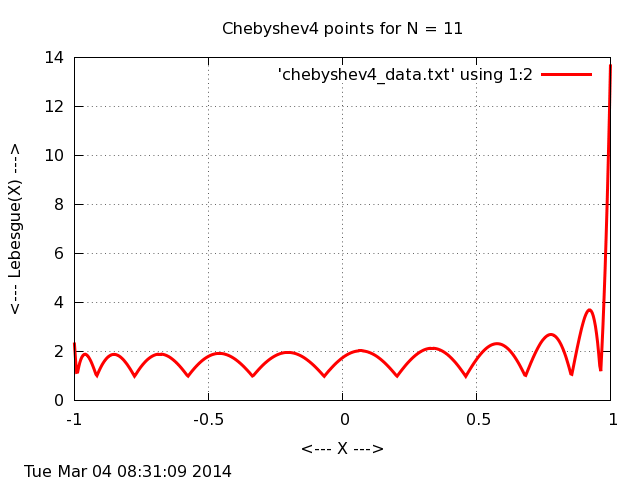
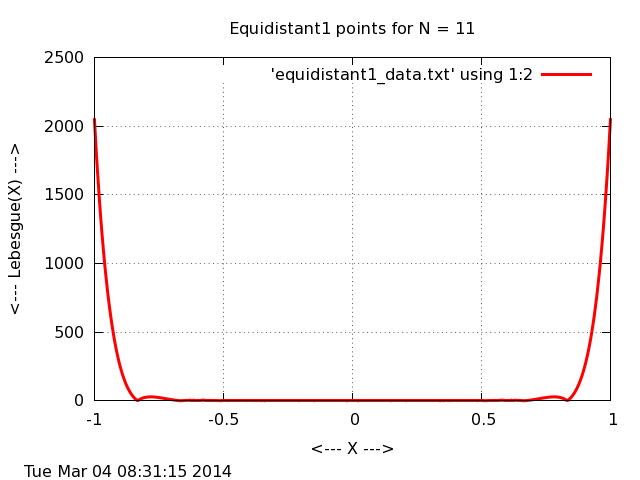
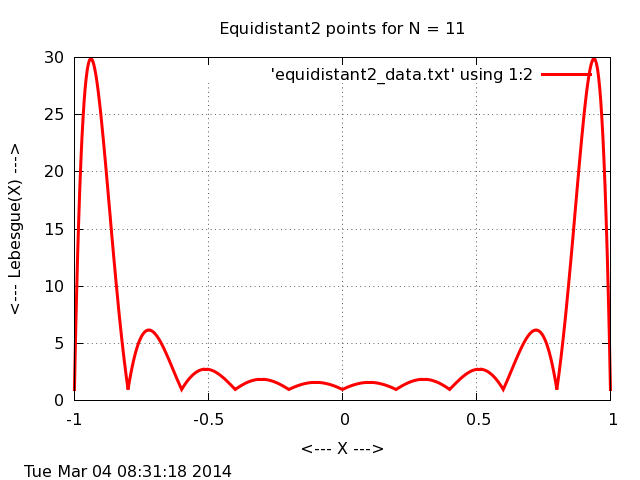
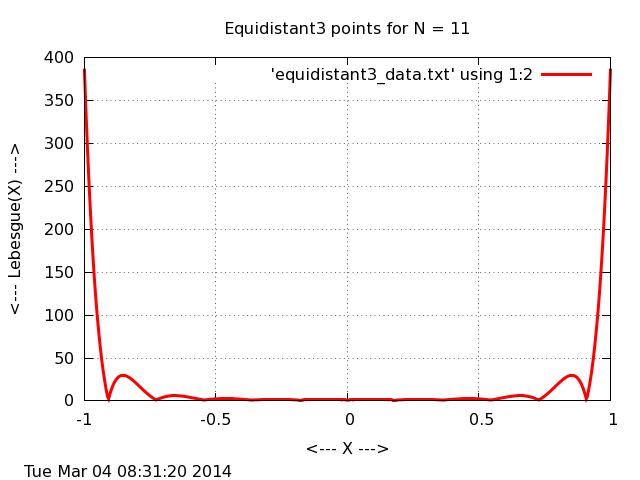
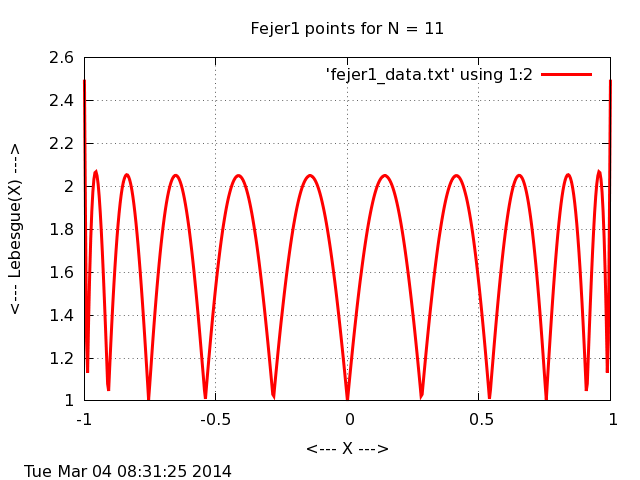
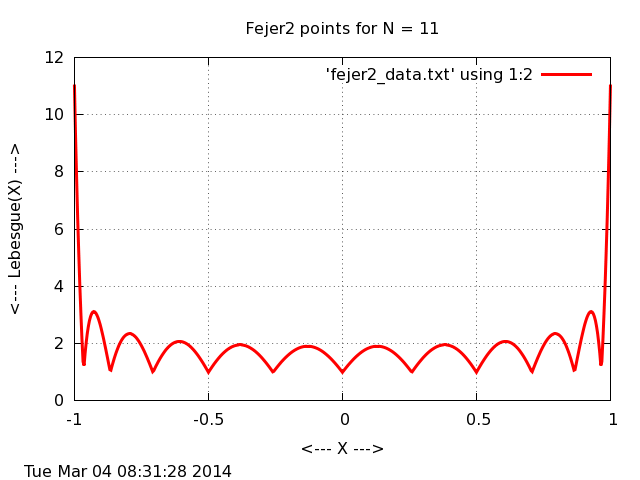
The Lebesgue function is formed by the sum of the absolute values of these Lagrange basis functions:
LF(X) = sum ( 1 <= I <= N ) | L(I)(X) |
and the Lebesgue constant LC is the maximum value of LF(X) over the interpolation interval, which is typically X(1) to X(N), or min ( X(*) ), max ( X(*) ), or [-1,+1], or some user-defined interval.
The computer code and data files described and made available on this web page are distributed under the GNU LGPL license.
LEBESGUE is available in a C version and a C++ version and a FORTRAN77 version and a FORTRAN90 version and a MATLAB version and a Python version.
GNUPLOT, C++ programs which illustrate how a program can write data and command files so that gnuplot can create plots of the program results.
INTERP, a C++ library which can be used for parameterizing and interpolating data;
QUADRULE, a C++ library which defines quadrature rules for approximating an integral over a 1D domain.
The test programs create plots of the Lebesgue function for specific sizes of the point sets.
You can go up one level to the C++ source codes.
Last revised on 04 March 2014.